Gold
New to Precious Metals
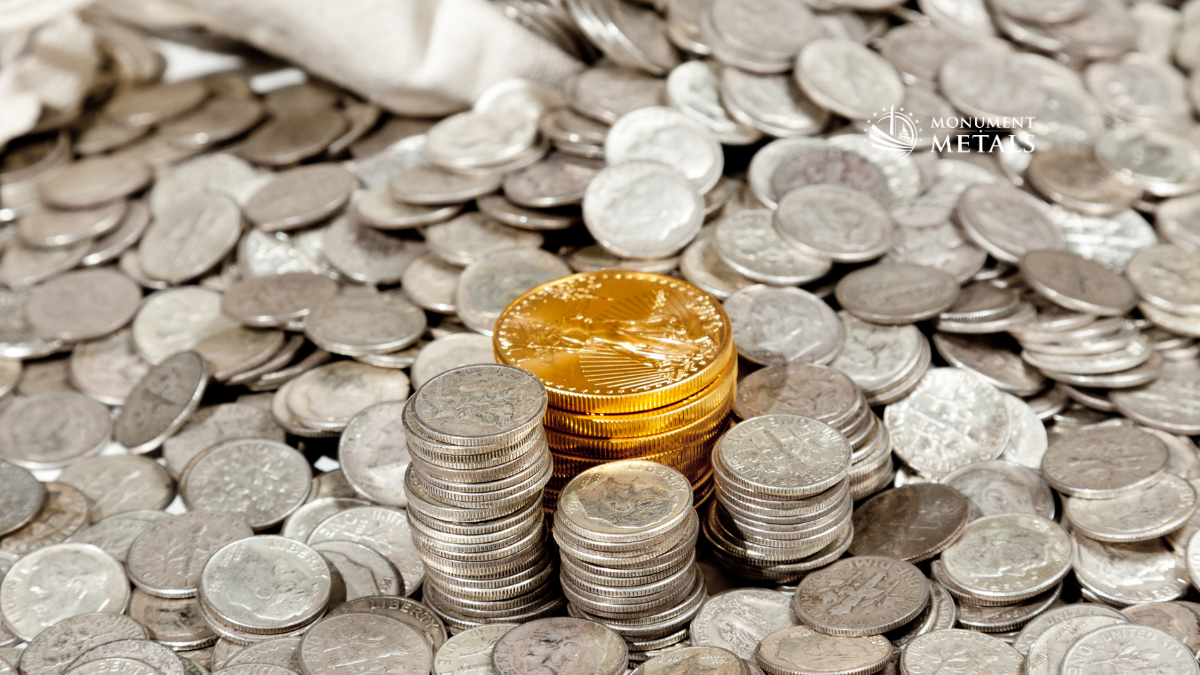


The gold-to-silver ratio is back above 80:1, and that's a number silver buyers have learned to watch closely. After silver's record run earlier this year, both metals have pulled back, and silver has fallen considerably faster than gold.
At about 82:1, one ounce of gold now costs roughly 82 ounces of silver. That’s well above the long-term average of about 59:1. Here’s what matters most: the ratio has never stayed this high for good. Every time it has climbed above 80, it has eventually fallen back, often sharply. That’s why we see a reading above 80:1 as one of the strongest buy signals for silver, and history backs that up.
Below, we'll walk through what the ratio is, where it stands today, how it has behaved in the past, and how you can use it when you shop for silver bullion.
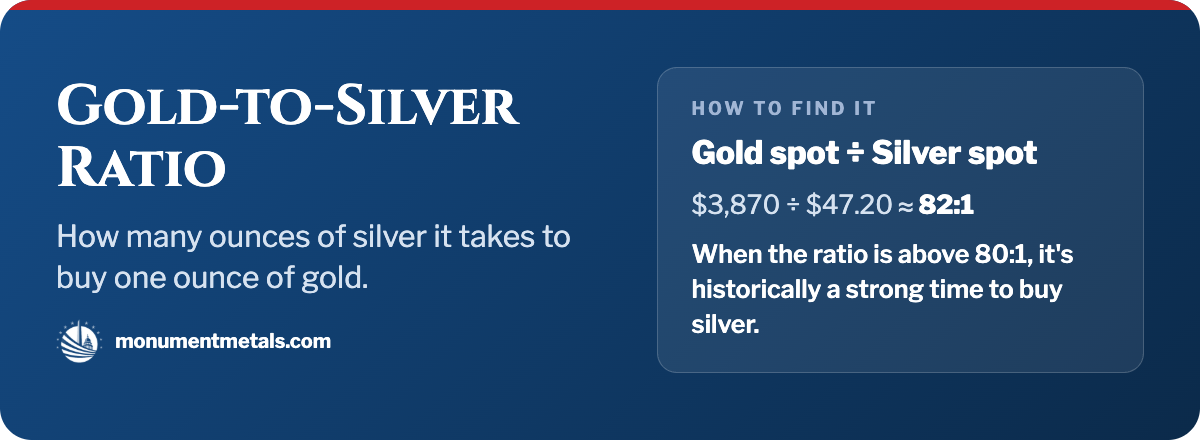

The gold-to-silver ratio tells you how many ounces of silver it takes to buy one ounce of gold. To find it, divide the gold spot price by the silver spot price. The spot price is the current market price for one troy ounce of raw metal, before any dealer premium is added. A troy ounce is the standard unit for precious metals, and it's a little heavier than the ounce on your kitchen scale.
That's really all the ratio is: a simple comparison. It doesn't tell you whether gold or silver is cheap in dollar terms. It tells you how the two metals are priced against each other.
It depends on how far back you look. One long-term dataset puts the average since 1968 at about 59:1, with a median around 62:1. The 30-year average is closer to 68:1.
Most investors treat readings above 80 as high, which signals that silver is inexpensive compared to gold. They treat readings below 50 as low, which signals that silver is pricey compared to gold. At about 82:1, today's ratio sits well above every one of those averages.
The gold-to-silver ratio has a long track record of falling back after it climbs this high. Here are three recent examples:
The timing has ranged from a few months to a couple of years, and past patterns don’t guarantee future results. But the direction has been the same every time. When the ratio gets this high, silver has historically caught up.
On the morning of November 16, 2026, gold spot was about $3,870 and silver spot was about $47.20, putting the ratio near 82:1. Prices move throughout the day, so check our live spot prices for the latest numbers. Both metals are trading near one-year lows, and silver has taken the bigger hit.
In January 2026, silver's record run took the ratio down to about 45:1, its lowest in over a decade. That day, silver hit $111.57 and gold was at $5,064.25. Since then, the ratio has nearly doubled. That’s a big swing in a short window, and it shows how quickly the relationship between the two metals can change. If history is any guide, it can swing back just as quickly.
Most of the pressure is coming from the same places for both metals, with a little extra weighing on silver:
The global silver market is still expected to remain in a supply deficit over the longer term, meaning demand is expected to outpace new supply. Short-term sentiment and long-term fundamentals don't always line up, and that gap is part of what makes this market worth a closer look.
The ratio has swung widely over the decades. Here are a few milestones worth knowing. Several of them are covered in more detail in our look at silver's three historic surges.
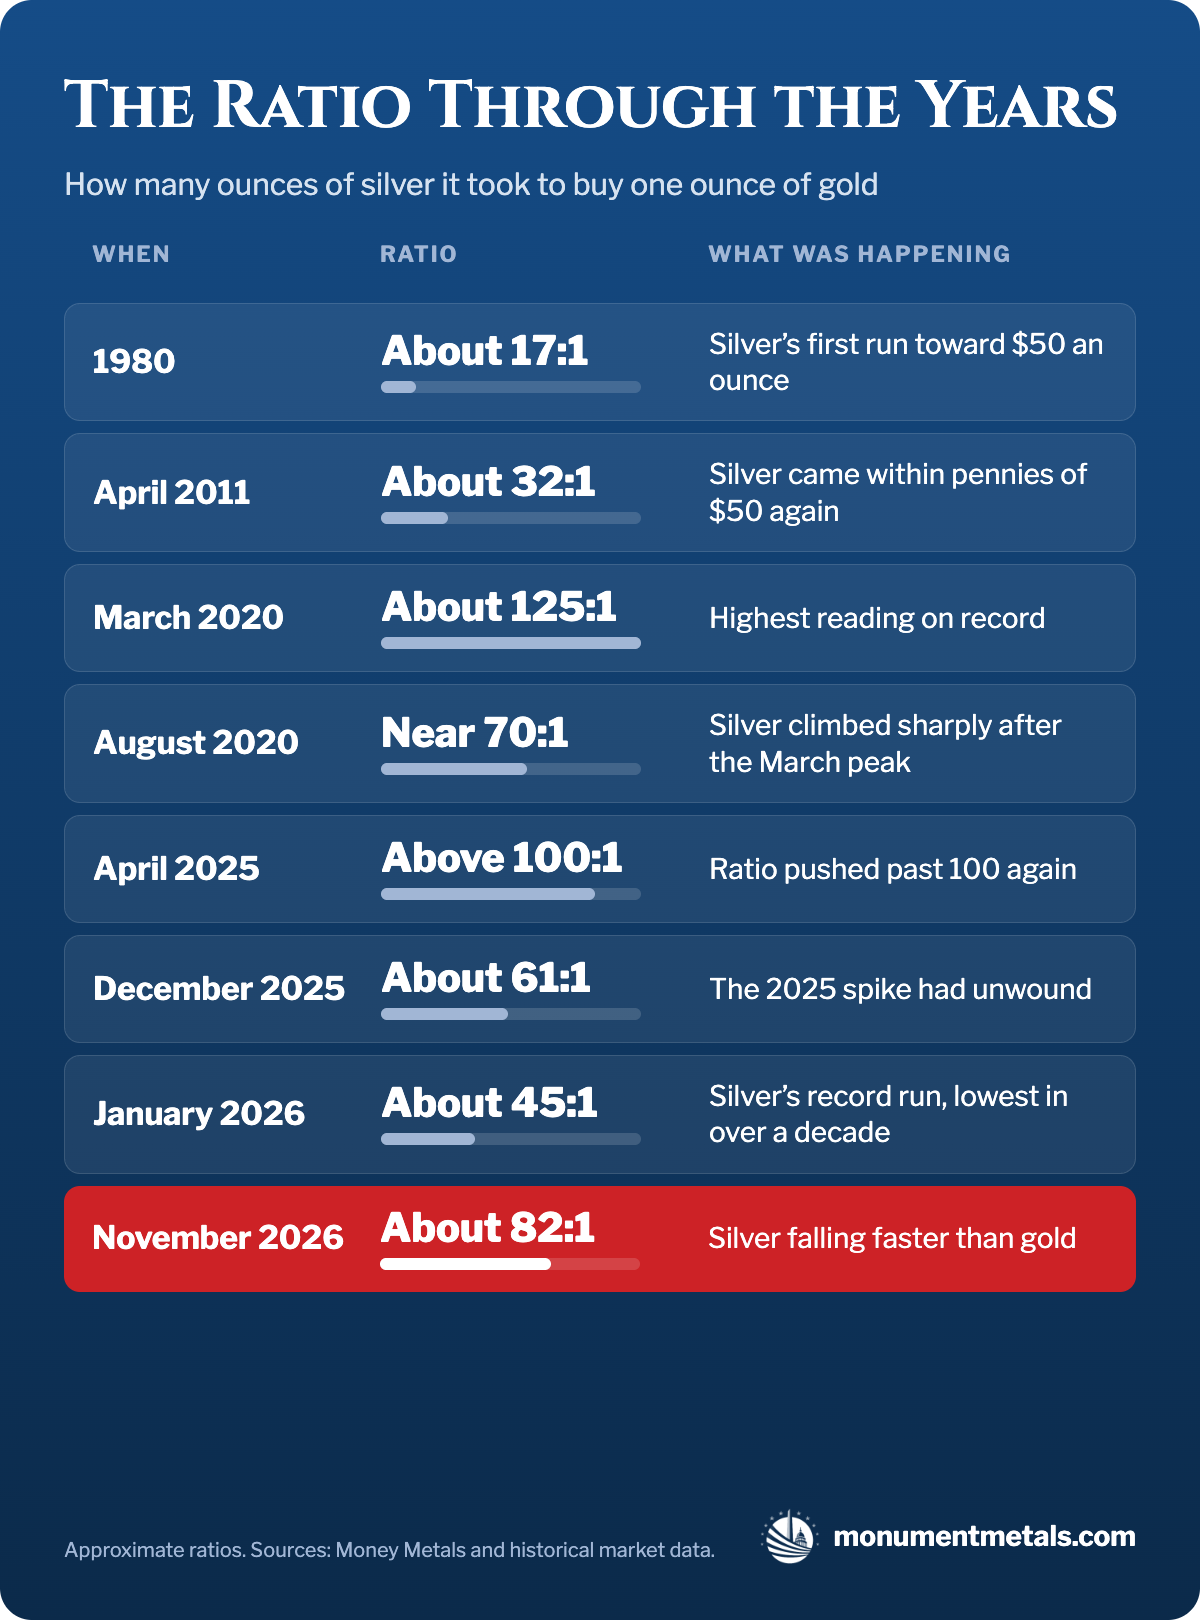 The ratio has ranged from about 17:1 in 1980 to a record 125:1 in March 2020. Every time it has climbed above 80, it has eventually come back down, and today’s 82:1 sits well above its long-term average.
This is the part that trips most people up. Think of the ratio as the price of one ounce of gold, paid in silver. At 82:1, gold costs 82 ounces of silver. At 50:1, it costs only 50.
When the ratio falls, each ounce of silver you own is worth more gold. When it rises, your silver is worth less. That's why silver buyers like to buy while the ratio is high, like it is now, and then hope to see it come down over time.
In other words, a high ratio is the time to buy, and a falling ratio is how that purchase pays off. If you've been waiting for lower prices, this is a very different market than the one we saw earlier this year.
Some investors actively trade between the two metals. They sell gold to buy silver when the ratio is high, then switch back when it falls. Most investors never sell what they own, though. Instead, they use the ratio to decide what to buy next.
When the ratio is high, like it is now, you might put your next purchase toward silver. When it's low, gold may be the better value, and a staple like the 1 oz American Gold Eagle could make more sense.

No one knows exactly where the bottom will be, and trying to time it perfectly rarely works out. Many buyers spread their purchases over weeks or months instead, an approach called dollar-cost averaging. Here's how dollar-cost averaging works when prices drop.
Here are a few popular ways to put today's ratio to work:
What is the gold-silver ratio? The gold-silver ratio shows how many ounces of silver it takes to buy one ounce of gold. You calculate it by dividing the gold spot price by the silver spot price. For more background, see our guide on what the ratio tells buyers.
What is a good gold-silver ratio to buy silver? Many investors consider a ratio above 80 a sign that silver is inexpensive compared to gold. The long-term average since 1968 is about 59:1, and the 30-year average is closer to 68:1.
Do investors actually trade gold for silver? Some do. They sell gold and buy silver when the ratio is high, then switch back when it falls. Most investors simply use the ratio to decide which metal to buy next.
What was the highest gold-silver ratio ever? The ratio reached about 125:1 in March 2020, the highest reading on record.
Does a high ratio mean silver prices will go up? Historically, every time the ratio has climbed above 80, it has eventually fallen back, often because silver caught up to gold. A high ratio doesn’t tell you exactly when that will happen or where prices are headed, but it’s one of the strongest signals silver buyers watch.
What's an easy way to start buying silver? Many first-time buyers start with 1 oz coins or rounds. Spreading purchases out over time with dollar-cost averaging can also take the pressure off timing.
Ready to put today's ratio to work? Browse our full silver selection online. Orders of $199 or more ship free.